Building a Loan Amortization Calculator with Streamlit and Plotly
- Johan
- Application , Data
- March 18, 2024
Table of Contents
Understanding how your loan payments break down between interest and principal is crucial for financial planning. Whether you’re buying a home, financing a car, or managing business debt, knowing where your money goes each month empowers better decision-making. In this tutorial, we’ll build an interactive loan amortization calculator that visualizes exactly how your payments are allocated over time.
The application we’re building uses Python, Streamlit for the web interface, and Plotly for beautiful, interactive charts. By the end, you’ll have a tool that not only calculates payments but also shows you the complete story of your loan through dynamic visualizations.
What is Loan Amortization?
Loan amortization is the process of paying off a debt through regular payments over time. Each payment typically consists of two portions: interest (the cost of borrowing) and principal (paying down the actual loan amount).
Early in the loan term, most of your payment goes toward interest. As time progresses, more goes toward principal. This creates an interesting pattern that our calculator will visualize beautifully.
Core Functionality: The PMT Function
At the heart of any loan calculator is the payment calculation. We’ve implemented Python’s equivalent of Excel’s PMT function:
def pmt(rate, nper, pv, fv=0.0, t=0):
    # Special case: if interest rate is 0
    if rate == 0:
        return -(pv + fv) / nper

    r1 = (1 + rate) ** nper
    return -(rate * (pv * r1 + fv)) / ((1 + rate * t) * (r1 - 1))
This function handles a critical edge case that many implementations miss: zero interest rates. When the rate is zero, the standard formula causes a division by zero error. Our implementation detects this and simply divides the principal by the number of periods—exactly what should happen with no interest.
Building the Amortization Schedule
The real magic happens in the generate_amortization_schedule() function. This creates a complete DataFrame tracking every payment across the loan’s lifetime:
- Period: Payment number (1, 2, 3…)
- Opening Balance: Principal remaining at the start of the period
- Payment Amount: The fixed payment (usually constant)
- Interest Portion: How much goes to interest
- Capital Portion: How much reduces the principal
- Closing Balance: Principal remaining after the payment
For each period, we calculate:
- Interest owed on the opening balance
- Capital portion (payment minus interest)
- New closing balance (opening balance minus capital)
This continues until the loan is fully paid off, creating a complete payment history that tells the story of your loan.
Interactive Visualizations
Numbers in a table are useful, but visualizations make the patterns instantly clear. Our calculator includes two key charts:
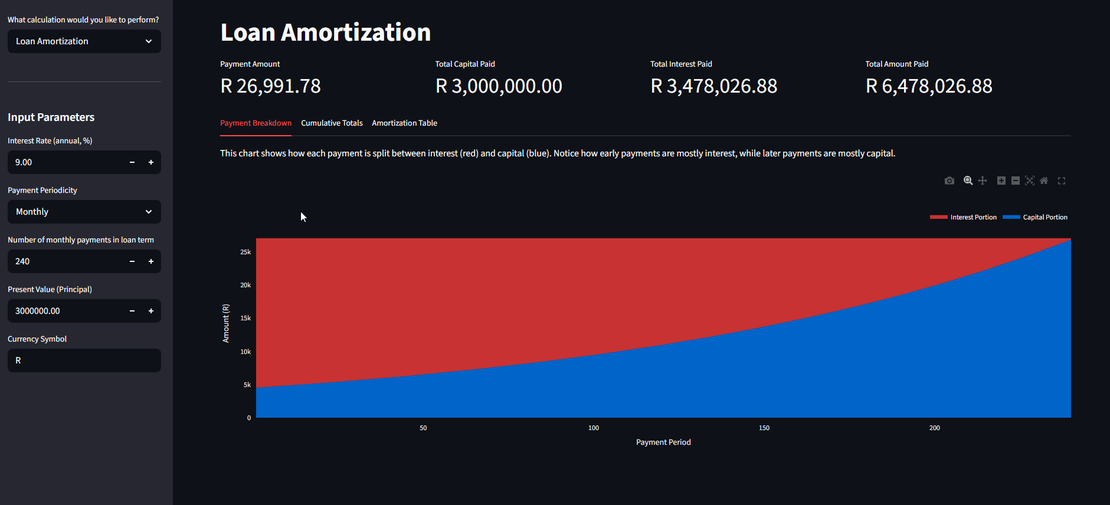
Payment Breakdown Chart
This stacked area chart shows how each payment is split between interest (red) and principal (blue). The visualization makes one of the most important aspects of loan amortization immediately obvious: early payments are dominated by interest.
For a typical 20-year mortgage at 9% interest, you might be shocked to see that your first payment is 80% interest and only 20% principal. But by the final payments, this flips dramatically—nearly 100% of your payment chips away at the principal.
Cumulative Totals Chart
The second visualization tracks cumulative payments over time. Two lines show:
- Total principal paid (blue line)
- Total interest paid (red line)
The gap between these lines represents your total interest cost. This chart answers questions like “How much interest will I pay in the first 5 years?” or “At what point have I paid more principal than interest?”
Smart UI Design
The calculator uses Streamlit’s clean interface to provide two modes:
Standard Payment Mode: Quickly calculate your payment amount given loan terms.
Loan Amortization Mode: The full analysis with:
- Summary metrics showing total interest, total principal, and total payments
- Three tabbed sections: Payment Breakdown chart, Cumulative Totals chart, and detailed Amortization Table
- Customizable currency symbol (defaults to “R” for South African Rand, but works for any currency)
- CSV download option for the complete schedule
All inputs are in the sidebar, keeping the main area focused on results and visualizations.
Handling Multiple Payment Frequencies
Real-world loans use different payment schedules: monthly, quarterly, semi-annual, or annual. Our calculator handles this through a periodicity_mapping:
periodicity_mapping = {
    "Monthly": 12,
    "Quarterly": 4,
    "Semi-Annual": 2,
    "Annual": 1,
}
When you select a frequency, the calculator automatically:
- Converts the annual interest rate to the periodic rate
- Adjusts the payment calculation
- Updates the amortization schedule accordingly
A 9% annual rate becomes 0.75% monthly, 2.25% quarterly, 4.5% semi-annually, or stays 9% annually.
Technical Implementation Details
The application leverages several Python libraries effectively:
Pandas creates structured DataFrames that are easy to manipulate and display. The amortization schedule is a perfect use case—tabular data with multiple related columns.
Plotly provides interactive charts that users can hover over, zoom, and explore. The go.Scatter traces with stackgroup='one' create the stacked area effect for the payment breakdown.
Streamlit handles all the web framework complexity, letting us focus on the financial logic. Features like st.metric(), st.tabs(), and st.download_button() create a professional interface with minimal code.
Real-World Applications
This calculator isn’t just educational—it’s genuinely useful for:
- Home buyers: Understanding how much of your mortgage payment actually reduces your loan
- Business owners: Analyzing equipment financing or business loan costs
- Financial advisors: Showing clients the impact of different loan terms
- Educators: Teaching financial literacy with interactive examples
The visualizations make abstract concepts concrete. Seeing the interest/principal split change over time drives home why making extra payments early has such a powerful effect.
Extending the Calculator
The foundation we’ve built is easily extensible. Potential enhancements include:
- Extra payment modeling: Show how additional payments shorten the loan term
- Comparison mode: Compare multiple loan scenarios side-by-side
- Refinancing analysis: Calculate the break-even point for refinancing
- Balloon payment support: Handle loans with large final payments
- Variable rate modeling: Simulate adjustable-rate mortgages
The modular structure—separate functions for calculations, schedule generation, and visualization—makes adding features straightforward.
Conclusion
Building a loan amortization calculator demonstrates how Python’s data science stack can create professional financial tools. The combination of precise calculations, comprehensive data structures, and interactive visualizations transforms raw numbers into actionable insights.
The complete application runs in a browser, requires no installation for end users, and provides instant feedback as loan parameters change. Whether you’re learning about finance, making borrowing decisions, or building tools for others, this calculator shows the power of modern Python frameworks.
Most importantly, it makes financial literacy accessible. Anyone can load the application, input their loan terms, and immediately understand the true cost of borrowing—not just the monthly payment, but the complete financial picture over the life of the loan.
Pro tip: Try experimenting with different loan terms in the calculator. You’ll discover that a small increase in interest rate can add tens of thousands to the total cost, while an extra payment per year can save even more. The visualizations make these impacts immediately clear.
Ready to start building? The complete code is available, and with Python, Streamlit, and Plotly installed, you can have your own calculator running in minutes. Understanding loans has never been more interactive—or more enlightening.